

The world of retail analytics is vastly interesting, especially when learning how imperative its use is in optimizing any business strategies within the retail sector. Luckily for you, this article will cover all your need-to-know basics of retail analytics, such as what it is, why it is important, and what its benefits are. We will go over the fundamentals of data analysis in retail, the various types of retail analytics, the tools and techniques a business could utilize, and the best practices of retail analytics. Lastly, we will cover the impact of data analysis in the retail sector, and the incredibly exciting future of retail analytics. Right, let’s get started!
What is Retail Analytics
Retail analytics is the use of various data analysis techniques within the retail sector. These techniques aim to improve all aspects of the business, as well as enhance the customer experience and overall satisfaction. The data is collected and interpreted from many different sources, such as feedback from customers, market trends, sales, etc. As a retailer, there are many questions that need answering, to make a business as successful as possible. For example, wouldn’t it be great to have the answers to which products are selling the best, and why? Who the most valuable customers are, and how to keep them happy? How to maximize profits by optimizing pricing and promotions? The list goes on, and on. Imagine the success that could be achieved if we had the answers to all these questions.
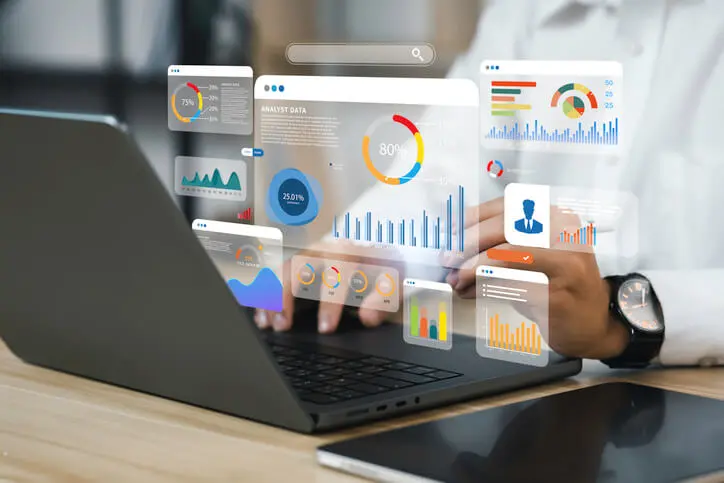
There are four main aspects to retail analytics. Data collection is the process of gathering a wide variety of data from sources such as point-of-sales systems, loyalty programs, web analytics, social media, etc. Data Processing, which is the process of transforming and integrating data in preparation for analysis. Data analysis is the application of mathematical and statistical methods to data in order to draw insight and direction from it. Data visualization, which is the presentation of the data in the form of a graph, or a more interactive form such as dashboards, charts, and reports. These communicate what the findings are, and enable and support decision-making.
Why is Retail Analytics so important?
Given how dynamic and cutthroat the retail industry is, the competitive edge a business can gain by implementing retail analytics is of top-notch importance. Some advantages to be gained by retail analytics include:
- Better understanding of the customer’s needs and preferences, making it possible to deliver a better service
- To optimize processes and operations, which can reduce costs while improving efficiency
- Improved sales and marketing strategies, aimed at attracting customers and increasing profits
- Increase innovation, making a business stand out from the competition with a great brand identity
- Monitor and measure performances and outcomes to evaluate and improve effectiveness and quality
Given the ever-changing landscape of the retail industry and consumer behavior, retail companies need help coping with the challenges and opportunities before them. Retail analytics brings with it the power of big data, artificial intelligence, and cloud computing to easily and accurately store, access, and analyze data to optimize decision-making.
Benefits of Retail Analytics
The benefits of retail analytics are far too numerous to mention them all, but it is definitely worth scanning through some of the most notable and most effective!
Sales and product performance analysis: By analyzing sales and performance data, you can identify your best-selling, as well as your underperforming products. It helps you understand how seasonality, price, etc can influence sales, while also optimizing product assortment, pricing, and placement. You can also apply different scenarios and strategies to test them first and see how they work for you.
Customer experience optimization through data analysis: Imagine a world where you can personalize and tailor products and offers to each individual type of customer. Retail analytics actually makes this possible. Data analysis helps optimize the customer experience by taking into account their needs, preferences, and feedback, thereby creating a more interactive customer experience.
Demand forecasting and inventory management: Retail analytics uses data to predict future sales, taking into account trends and external influences, to accurately forecast demand and inventory levels. It helps you manage your inventory optimally when it comes to replenishment and distribution while saving money on holding and ordering costs.
Price and product placement analysis: Product placement and tactics make a big difference in sales. Visibility and accessibility are huge factors. Retail analytics has product placement down to an art, while also optimizing the price based on factors such as demand, competition, and cost.
Customer behavior analysis and market segmentation: Retail analysis can analyze customer behavior data to give you better insight into what motivates your customers. It shows you how they interact with your products and services, and how they respond to different incentives such as promotions and product placement. It also segments the market into different groups and identifies the most profitable segments, helping you direct special marketing and sales campaigns toward those groups.
Fundamentals of Data Analysis in Retail
Data analysis is the application of mathematical and statistical methods to data. The insight gained from this helps with decision-making and helps to swiftly identify trends or problems, and test speculations. Data analysis involves three basic steps: data collection, data processing, and data analysis, all of which we have already discussed in detail earlier in this article. Data analysis can provide answers to some burning questions. What is happening in the market and in the business? Why is it happening and what are the causes and effects? What will happen in the future and what are the probabilities and uncertainties? What should happen and what are the best actions and decisions? With these questions answered it certainly takes the guesswork out of decision-making.
There are two types of data used in the retail sector. The first type is structured data. This data is predefined in format and structure, such as dates, numbers, and categories. It is data that is easily accessed and analyzed, using spreadsheets and databases. The second type is unstructured data. In contrast, this data has no predefined format or structure, such as video, text, and audio. It is more difficult to access and analyze with the use of traditional methods, so it requires specialized tools such as speech recognition and computer vision.
Types of Retail Analytics
Retail analytics can be divided into four main types, with each type providing different insight and direction. The type you use depends on your objectives. They are as follows:
Descriptive Analytics
This is the simplest type of retail analytics. It shows you what has happened in the past and what is happening now. It uses the most basic mathematical and statistical methods, such as mean, mode, frequency, and percentage, to calculate indicators such as sales, profits, and market share. It communicates findings by charts, dashboards, tables, and reports. It can tell you how many products you have sold over a period and what the sales were at the same time last year, as well as what your best and worst-selling products are. It tells you your customer volumes, both in-store and online, and compares it to the same period the previous year. It also shows you how satisfied your customers are with various products and segments.
Diagnostic Analytics
Diagnostic analytics is a higher level of retail analytics, which goes a step further to understand why things have happened previously, or are happening now. The mathematical and statistical methods used are more advanced, such as regression, and factor analysis. It measures variables between factors such as price, market conditions, and promotions. Diagnostic analytics also makes use of interactive methods to explore findings from different perspectives. It can identify your main sales drivers and how they vary by category. It also tells you how price changes, promotions, and display placement affected sales, profits, and customer behavior.
Predictive Analytics
This type of retail analytics is even more advanced and can forecast what is still to come in the future. Its statistical and mathematical methods are advanced methods like time series, and trend analysis, which predict future outcomes based on current and historical data. It makes use of simulation methods, such as linear programs, and genetic algorithms to test the feasibility of different strategies. Predictive analytics can tell you what your expected sales and profits will be for the next month for individual products and categories, as well as what volume of customers you can expect through your store and online. It can even tell you what factors are likely to influence customers’ choices, and how satisfied and loyal they will be in regards to your various products and segments.
Prescriptive Analytics
The most advanced and complex type of retail analytics that can show you exactly what decisions and actions are most favorable. It makes use of intelligent and automated methods, such as artificial intelligence, and decision support systems. These systems give you optimal solutions based on data, models, and constraints, as well as using learning methods, and deep learning. This gives the system the ability to adapt solutions in different situations. Prescriptive analytics can tell you what the optimal price of products should be to maximize profits while minimizing risks. It can also maximize product placement and visibility while minimizing waste. It optimizes inventory levels while reducing the risk of stockouts or overstocking, all while minimizing costs at the same time. It can even optimize sales and marketing campaigns.
Tools and Techniques of Retail Analytics
The tools and techniques available to businesses are quite incredible. The way they collect and analyze data in order to generate insights is unbelievable. Join us as we explore some of the available options.
Software and platforms for retail-specific data analysis: Oracle Retail Analytic and Microsoft Dynamics 365 Commerce are just some of the software and platforms developed for retail-specific data analysis. Some of their many functions are data reporting, data security, and data storytelling, which all work together to provide retailers with comprehensive solutions for data processing and analysis.
Utilization of machine learning algorithms and artificial intelligence in retail data analysis: These advanced methods make it possible for retailers to perform highly complex data analysis, such as predictive analytics, in order to optimize decisions and actions. Some of the many advantages retailers can gain from machine learning algorithms and artificial intelligence is to discover patterns and trends, test and evaluate hypotheses, and generate and evaluate solutions. Some of the available techniques that can be used are regression, computer vision, and anomaly detection.
Methods of data collection, processing, and visualization in the retail context: Data can be gathered from sources such as social media, e-commerce platforms, and loyalty programs, to name a few. It is essential that the data is of a high quality for it to be usable. There are two methods of data collection. Firstly, the passive data collection method involves tracking data from customers, such as transactions, clicks, views, and comments. The second type is active data collecting which is obtained through questionnaires, surveys, and focus groups. The way data is cleaned and integrated to prepare it for analysis is also divided into two types. Type one is the batch data processing method, which involves processing data in large batches, either daily, weekly, or monthly. Type two is the stream data processing method, where data is processed in small, continuous streams, such as real-time. Data visualization methods refer to the way the data is presented, be it in graph form or interactive form, and also have two types. Type one is the static data visualization method, which is when data is displayed in a fixed form, such as a printed report. The second type is the dynamic data visualization method, where data is displayed in a flexible form, such as an online dashboard.
Best Practices of Retail Analytics
While retail analytics is an incredibly valuable tool, it is, unfortunately, not without its challenges. In order for a retailer to use analytics to its full potential, there are some best practices that should be followed.
Lean heavily on customer data: This data should always be the most important data to any retailer. Understanding your customer’s wants and needs helps you tailor your products to their specific preferences. Customer data should drive your business decisions and actions and should be collected and analyzed as often as possible.
Use visualization tools: Visualization tools help retailers communicate their data in a clear way. They help highlight important indicators, such as sales and customer satisfaction, and display them as graphs, charts, etc. These visual tools help retailers examine data from different angles in order to gain deeper insight, before making decisions and taking action.
Analyze multiple data sources: Using limited data sources can lead to inaccurate findings. By analyzing multiple data sources, such as sales transactions, competitor actions, and market trends, it can give you a more comprehensive view of the market. This can aid retailers to spot new trends and identify and solve problems quickly.
Track KPIs: Key performance indicators (KPIs) are measurable values that indicate where a business’s performance is, in relation to its objectives. Tracking sales, profits, and customer satisfaction can help you measure your performance and improve your quality. To ensure that goals are realistic, retailers should align their KPIs with the SMART (specific, measurable, achievable, relevant, and time-bound) goals they set.
Prioritize your goals: Prioritizing your goals makes it possible to focus your finances, time and people on the most important ones, rather than trying to achieve everything at once. This makes goals less overwhelming, and prevents you from being distracted and becoming less effective in achieving your desired outcomes.
Impact of Data Analysis in the Retail Sector
The impact data analysis has made on the retail industry is significant, to say the least. Let’s explore some of the many ways that it has changed the way the industry operates.
Enhancement of business decisions and marketing strategy: Data analysis has taken the guesswork out of decision-making. By gaining data-driven insight, retailers are able to make faster decisions and enhance their marketing strategies. It has enabled them to identify and solve problems, spot new patterns, innovate their products, and create unique brand identities.
Increase in operational efficiency and cost reduction: Data analysis optimizes operations and processes, thereby reducing costs and increasing productivity. Optimizing demand and inventory forecasting, as well as pricing and product placement, minimizes errors and waste, which reduces costs and risks.
Creation of personalized and engaging customer experiences: Data analysis helps retailers understand their customers’ needs, expectations, and preferences. These characteristics enable them to tailor their services, products, and special offers specifically to suit each customer or segment. A more personalized and interactive customer experience creates loyalty.
Rapid adaptation to market trends and changes in consumer preferences: Data analysis helps retailers improve their effectiveness by monitoring changes in consumer preferences and market trends, enabling them to adapt quickly to any changes.
The Future of Retail Analytics
Retail analytics is growing rapidly due to the constant changes happening in the retail, data, and technology sectors. There is a constant drive for retailers to leverage more data and use more sophisticated tools and techniques, in order to gain a competitive edge. But when should you upgrade your retail analytics? When a business faces new challenges or opportunities, or when they are busy innovating their products, would be the most optimal time to upgrade. Furthermore, an upgrade is also necessary as a business gains access to more and better data, or as they begin to perform more complex data analysis, such as predictive or prescriptive analytics. It is also a good idea to upgrade your retail analytics software when you want to drive more revenue. Better software helps optimize pricing and product placement, forecast demand more accurately so that there is less wastage or stockouts, and better manage inventory distribution. This all increases revenue.
Intuendi is at the forefront of technological advancement in data analytics in the supply chain, leveraging AI and ML technology to provide insights for the decision making process. Contact us to learn more!
