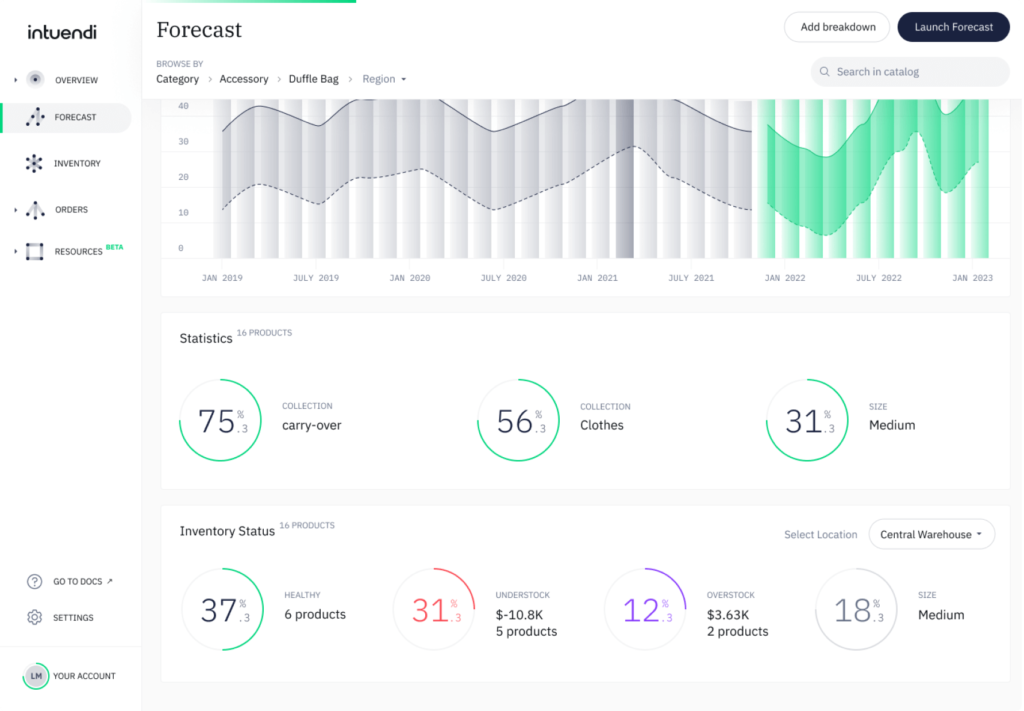
Companies and supply chain managers should be aware of the following characteristics of demand forecasts as it helps in understanding the role of demand forecasting software.
- Demand forecasts are always wrong, even those generated from demand forecasting software, and at times should include both the expected value of the forecast and a measure of forecast error
To help understand the importance of demand forecast error, consider the example of two companies that sell widgets. One of them expects sales to range between 100 and 1,900 units, whereas the other expects sales to range between 900 and 1,100 units. Even though both companies anticipate average sales of 1,000, the sourcing policies for each company should be very different given the difference in forecast accuracy. Thus, the forecast error (or demand uncertainty) must be a key input into most supply chain decisions. Unfortunately, most firms do not maintain any estimate of forecast error. Lucky with Intuendi demand forecasting software we take that into account, and you sell your forecast error reduce dramatically.
- Long-term demand forecasts are usually less accurate, even with demand forecasting software than short-term demand forecasts; that is, longterm demand forecasts have a larger standard deviation of error relative to the mean than short-term demand forecasts.
Retails companies are known to use demand forecasting software to exploit this key property to improve their performance. Retail companies are creating a replenishment process that enables it to respond to an order within hours. For example, if a store manager places an order by 10 A.M., the order is delivered by 7 P.M. the same day. Therefore, the manager only has to demand forecast what will sell that night less than 12 hours before the actual sale. The short lead time allows a manager to take into account current information, such as the weather, which could affect product sales. This demand forecast is likely to be more accurate than if the store manager had to demand forecast demand one week in advance. This can be all automated with the use of demand forecasting software.
- Aggregate demand forecasts are usually more accurate than disaggregate forecasts, as they tend to have a smaller standard deviation of error relative to the mean.
For example, it is easy to forecast the Gross Domestic Product (GDP) of any country for a given year with less than a 2 percent error. However, it is much more difficult to forecast yearly revenue for a company with less than a 2 percent error, and it is even harder to forecast revenue for a given product with the same degree of accuracy. The key difference among the three forecasts is the degree of aggregation. The GDP is an aggregation across many companies and the earnings of a company are an aggregation across several product lines. The greater the aggregation, the more accurate is the demand forecast.
- In general, the farther up the supply chain a company is (or, the farther it is from the consumer), the higher is the distortion of information it receives.
One classic example of this is the bullwhip effect, in which order variation is amplified as orders move farther from the end customer. As a result, the farther up the supply chain an enterprise is, the more significant is the demand forecast error. Collaborative demand forecasting based on sales to the end customer helps upstream enterprises reduce demand forecast error.
These are the main characteristics of demand forecasts of which our Inventory forecasting software can help, to find out more, please contact us by clicking on the button below.


