
It is imperative to the system of operations that businesses take note of what stock is selling and how quickly it is selling. This helps businesses assess the efficiency of their inventory management, demand forecasting, and marketing strategies, allowing them to make any necessary adjustments to improve their sales. The way in which this is usually calculated is by using the inventory turnover ratio. This article will explore its practical applications and strategic value, by looking at the factors that affect it and how to implement the ratio calculation.
What is Inventory Turnover?
The inventory turnover ratio, or a business’ inventory turnover, refers specifically to the number of times a business has sold and replaced its stock within a given period. This financial ratio allows a company to calculate how long it may take, on average, to sell its inventory.
As previously mentioned, the main benefit of knowing your company’s inventory turnover ratio allows for more effective inventory management strategies to be implemented, as the ratio will assist in highlighting weak points within the current inventory management system. Knowing this metric additionally allows for a better understanding of cash-flow management, through inventory optimization, and decisions dealing with pricing and purchasing.
Consider a retail outlet stocking a wide array of trendy, fast-fashion items. Because of the constant, high demand for these clothing items, coupled with effective marketing strategies and the implementation of strong inventory management software, the company sees a high inventory turnover ratio. Selling and replacing inventory several times a year will result in the company generating more revenue and profits.
In general, the ITR plays a crucial role in business success for 2 main reasons – stock purchasing and sales issues. Let’s assess:
Stock purchasing: A company can purchase too much inventory over a fixed time period and will have to take action to sell it all in order to boost the inventory turnover rate. However, companies that acquire too much inventory often face challenges in selling their excess inventory. This results in additional expenses such as storage and inventory holding costs, or extra labor issues.
Sales issues: Sales and purchasing departments should always work collaboratively. Sales must always match the inventory purchases, otherwise, an imbalance in inventory turnover can be the result. To tune the sales and purchases between each other, you can use an inventory turnover ratio calculation.
How to Calculate Inventory Turnover
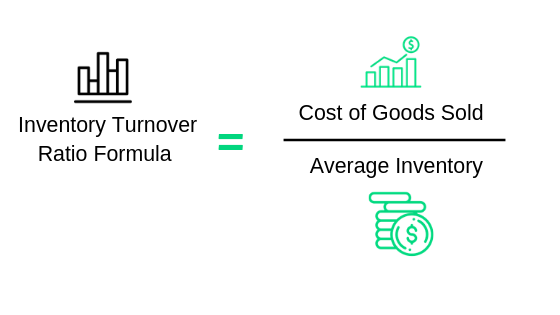
The inventory turnover calculation is a simple ratio that divides the cost of goods sold by the average value of inventory. Cost of goods (COGS) refers to the cost of goods sold, as this represents the direct costs associated with the production or acquisition of the goods sold during a specific period.
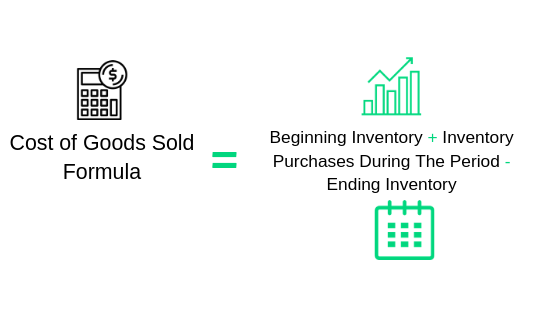
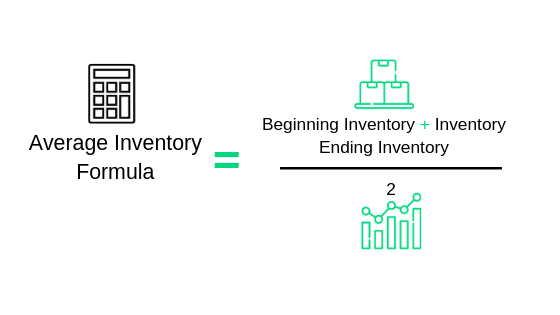
Cost of goods is used instead of physical sales as the sales amount will include the mark-up, whereas the inventory turnover ratio is more interested in the total cost to the company. Here is the inventory turnover formula:
The equation for inventory turnover
Improve your financial efficiency ratio and unlock smarter growth strategies. Discover our ROI calculator
Inventory Turnover Definition
There are quite a few KPIs that managers use to evaluate their inventories to keep them under control. One of the most widely used, although not so trivial to assess, is the Inventory Turnover index. It is, roughly speaking, an indicator that tells you how many times, during a year, your inventory is completely replaced.
Let me give a practical example. Assume you can evaluate the average level of your inventory during the year; the inventory is typically composed of raw materials, work in progress, and finished goods. The table reports an example:
| item | average numb | unit value | total value | ||||||
| Raw material | A | 1000 | $50.00 | $50,000.00 | |||||
| Raw material | B | 2000 | $20.00 | $40,000.00 | |||||
| Raw material | C | 1200 | $40.00 | $48,000.00 | |||||
| Work in Progress | X | 200 | $200.00 | $40,000.00 | |||||
| Work in Progress | Y | 400 | $300.00 | $120,000.00 | |||||
| Finished goods | F | 60 | $1,200.00 | $72,000.00 | |||||
| Finished goods | G | 40 | $1,400.00 | $56,000.00 | |||||
| Finished goods | H | 50 | $1,500.00 | $75,000.00 | |||||
| Total | $501,000.00 | ||||||||
So the average (in a year) aggregate (across all items) value of your inventory is roughly half a million dollars. If, for example, the total cost of units sold in a year is 2 million dollars, in this case, the Inventory turnover index will be 4:
Inventory turns = (2,000,000/501,000) = 4 turns
Roughly speaking, in order to sell all these goods you are going to completely substitute your inventory four times in a year. Caution: This is a synthetic measure (an aggregate one) and it is concerned only with value, not real inventory levels.
The Inventory turnover index can be tricky to analyze: Is 4 times a year a low value? Or is it too high? One possible answer is: look at the index of your competitors and benchmark towards the top in your market.
Additionally, the same index can be seen upside-down: if you divide the average value of the inventory by the cost of sales you end up with the number of “years of supply” granted by your inventory. This is not practical, so multiply by 52 and you get the Weeks of Supply. In this case:
Weeks of supply = (500,000/2,000,000)*52 = 13
This index tells you that, on average, your inventory “grants” 13 weeks of supply. Again: it is a synthetic measure – do not trust it to make replenishment decisions. For this, we, at Intuendi, have much smarter solutions with our inventory optimization tool.
Interpretation of Inventory Turnover Ratio
Earlier in the article, the concept of a high inventory turnover rate was introduced. But what is it? The description of a high or lower stock turnover explains how inventory turnover ratios are interpreted once calculated. A low stock turnover rate indicates weak sales, and that cash may be tied up in excess, unsold products that are taking up too much space within storage. This can point to issues in various sectors, be it marketing or inventory management. A high ratio, on the other hand, usually implies that stock is selling well and that more stock should be purchased.
Retail giant, Amazon, is famous in the supply-chain industry for its high turnover ratio. As one of the leading, global companies, Amazon experiences a high turnover ratio due to the company’s recognition and awareness, large volume of sales and high product demand. Overall, Amazon’s high inventory turnover ratio is a clear indication of its operational efficiency and ability to meet customer demand.
A well-known company with a low inventory turnover is none other than the jewelry company, Tiffany & Co. Their low turnover rate can be attributed to the high cost and slow-moving nature of their luxury products. However, Tiffany & Co. has maintained a strong financial performance, despite its low inventory turnover ratio, due to its high profit margins and loyal customer base. Tiffany & Co. does not only serve as an excellent breakfast location, it also serves as an interesting example of how a low-turnover company can maintain profitability through strategic planning and marketing.
Factors Affecting Inventory Turnover
Unlike Tiffany & Co. many other companies with a low inventory ratio, however, can usually attribute this result to poor sales. But how does this occur? Here is a list containing a few factors affecting inventory turnover:
- Industry: As in the Tiffany & Co. example, the industry that a company operates within can often dictate its turns ratio.
- Demand: When demand is high, a company may sell its inventory quicker, resulting in a higher inventory turnover ratio. In contrast, when demand is low, a company may struggle to sell its inventory. This can also be worsened by external factors such as seasonality and current affairs.
- Pricing Policies: Pricing products correctly will help mitigate issues of high-priced stock not selling, or low-priced stock selling too fast without any back-up inventory. Both cases can result in a company not generating enough revenue to cover costs.
- Inventory Management: Companies with poor implementation of inventory management can find themselves in situations of overstock or understock.
- Competition: A company within a competitive industry might need to adjust its pricing strategies and marketing efforts to maintain a competitive advantage and achieve a higher turnover ratio.
How Many Turns of Inventory do you do?
Average Inventory Turnover Period
Also known as Days’ Sales of Inventory (DSI), the average inventory turnover period is the average number of days it takes for a company to sell its entire inventory. Differing from the inventory turnover ratio that looks at the amount of times a business has sold and replaced its stock, this calculation represents the average length of time that inventory is held before it is sold. However, the ratio is necessary for the average inventory turnover period formula:
Average Inventory Turnover Period = Number of Days in Period/Inventory Turnover Ratio
A working example: if a company has an inventory turnover of 5 and the period in question is one year, or 365 days, the average inventory period would be calculated as such:
365 days/5 = 73 days. Meaning, on average, it takes the company 73 days to sell its entire inventory. The average inventory turnover period can provide insight into a company’s inventory management practices and efficiency, where a shorter period indicates that a company is efficiently managing its inventory and quickly turning over its stock and a longer period points to excess inventory or slow-moving products. Calculating this metric can also be useful for benchmarking your company against your own historical performance, as well as industry peers.
What is a Good Inventory Turn?
The ideal values for the inventory turnover ratio point to a higher ratio indicating that a company is selling and replenishing its inventory frequently. This is, however, very much subject to the industry of the company as well as any other specific circumstances outside the realm of inventory management efficiency and pricing strategy. The size of your manufacturing company, as well as the industry in which you operate, are two important factors to take into account. If you are a small business, do not strive for an ITR achieved by much larger, more renowned companies.
Improving one’s turnover ratio can bring benefits from optimized inventory levels to reduced holding costs, from increased cash flow to improved profitability. These factors are synonymous with customer satisfaction, as a high ratio implies that there is good product availability and that the company can and has responded effectively to market demands. By monitoring and improving their inventory turnover ratio, businesses can enhance their operational efficiency, financial performance, and competitiveness in the market. Strive to make your inventory work for you, and not against you.
How to Improve Your Inventory Turnover
With the boom of e-commerce, globalization, and a general increase in international trade, a modern business must tackle the complexities of handling multiple distribution centers, points of sale, and sales channels rendering Inventory Management a real challenge. A low inventory turnover rate brings up a lot of disadvantages. The most common ones are obsolete inventory accumulation and extra inventory storage costs. There are several ways you can improve your ITR if you have a low inventory turnover.
Forecast the Demand in Advance: Consumer demand is the most unstable thing in the business. Given the seasonality and trends, we can explicitly state that not all items are constantly wanted and desired by customers. If you want to manage your inventory and make sure that it sells well, you need to become a demand-driven business that manages all the inventory. Whether forecasting manually, or supported by software, your previous historical data can help you come up with specific trends. Analysis of these trends provides insight into how and why specific products sell well better or poorly. Eventually, by forecasting the demand and ordering the amount of stock that will correspond to the demanded number, you will improve your ITR.
Increase the Demand via Promotions: If you find yourself carrying too much inventory, you need to find a way to get rid of it ASAP. There are many techniques one can use to sell the excess inventory – and promotions are one of them. Discounts and promotions are the best way to boost sales by increasing the demand for slow-selling products. When you have too much inventory on hand, this means that it’s high time to enhance your marketing efforts. Consider using steep discounts that are available for a limited time only. The limitation of time creates a sense of urgency. There is also the option of using promotional methods, such as bundling the slow-moving products with fast-selling ones. Additionally, a gift option for a purchase succeeding over a specific amount could also be considered. Remember that it is always more efficient to sell the product at a lower rate rather than keeping excess stock.
Evaluate How Effective Your Pricing Strategy Is: Sometimes if products are not selling well, the problem lies not in the lack of interest, but in how the items are priced. While all businesses want to ensure a high ROI and maintain stable margins, setting an unaffordable price on the products can leave your business with no sales at all. However, the solution is not as simple as lowering the prices to make them more appealing. Creating an effective pricing strategy means that you consider all the factors that influence the value. These include all the raw materials, staff, processing costs, expenses, and competitors’ rates.
