How often do you find your business overstocked with what customers don’t want, and understocked with what they do want? For many companies, it’s a regular occurrence and this costly imbalance is exactly what demand planning exists to solve. Demand planning is the critical process of aligning supply with customer demand, turning market signals into an actionable operational plan. But navigating this complex process without the right tools leads to reactive decisions, inefficiencies, and costly inventory imbalances. Key Performance Indicators (KPIs) are those tools.
A KPI is a quantifiable measure directly tied to a strategic business objective, telling you not just what happened, but whether or not you are on track to achieve your goals. This makes it crucial to distinguish between sales forecasting, which is an essential input predicting future sales, and demand planning, which is the holistic process of using that forecast to shape inventory, production, and financial strategies. Managing this process with the right data is a non-negotiable requirement for any modern supply chain.
Why KPIs Are Crucial for Demand Planning Success
A well-chosen set of KPIs does more than just track performance, it actively shapes it and directly impacts your bottom line. The benefits of well chosen KPIs are felt across the entire company, starting with fundamentally improved inventory management. By measuring what truly matters, businesses can dramatically reduce the holding costs associated with excess stock. This prevents capital from being tied up in products sitting on the shelf and minimizes the risk of writing off obsolete inventory. The result is optimized working capital that can be invested back into growth.
This kind of operational efficiency translates directly to enhanced customer satisfaction as well. When your planning is accurate, key indicators like fill rate and on-time delivery naturally improve. Customers receive what they ordered when they expect it, and they’re happy as can be. This reliability builds trust and fosters loyalty in a way that marketing campaigns alone cannot.
Ultimately, KPIs empower your team to make strategic, data-informed decisions. During Sales & Operations Planning (S) meetings, a clear dashboard of KPIs aligns everyone from sales to finance and operations around a single version of the truth. This alignment ensures that short-term actions are consistent with long-term strategic goals, driving the business forward with purpose and precision.
The Core Categories of Demand Planning KPIs
To gain a complete picture of performance, demand planning teams need a balanced portfolio of KPIs. Focusing on a single category, such as forecast accuracy, can create blind spots and unintended consequences. For example, a highly accurate forecast is meaningless if it ends up leading to stockouts.
A truly effective KPI framework takes a holistic approach, offering a multi-faceted view of the entire demand planning ecosystem.
The essential KPI categories outlined below work together to provide a 360-degree perspective. From Forecast Accuracy and Bias to Inventory Performance, Customer Service and Fulfillment, and Process Efficiency, they form a unified dashboard that helps teams navigate complexity and make smarter supply chain decisions.
Essential KPIs for Demand Planners Explained
Forecast Accuracy and Error Metrics
These KPIs measure how close your forecast comes to actual sales. We like to think of this as the fundamental report card for your planning efforts.
- Forecast Accuracy (FA) is the most intuitive metric, expressed as a percentage. It simply calculates how much of your forecast was correct. While easy to understand, it doesn’t always show the full picture of error magnitude.
- Mean Absolute Percentage Error (MAPE) measures the average size of the forecast error in percentage terms. It is excellent for comparing forecast performance across different products or categories at a high level. However, MAPE can be heavily skewed by low-volume items, where a small unit error can result in a massive percentage error.
- Weighted Mean Absolute Percentage Error (WMAPE) solves MAPE’s main weakness. It measures accuracy while giving more weight to the items that matter most, typically based on volume or value. This ensures your attention is focused on the products that have the biggest impact on the business.
- Mean Absolute Deviation (MAD) calculates the average forecast error in terms of units. It provides a straightforward, easy-to-communicate measure of error size, helping planners understand the potential unit variance they need to buffer for.
Forecast Bias Metrics
While accuracy measures the size of your errors, bias measures their direction. Identifying and correcting systemic bias is critical for long-term improvement.
- Forecast Bias (also known as Mean Forecast Error) reveals any tendency to consistently over-forecast (positive bias) or under-forecast (negative bias). A persistent bias signals a systemic issue in your model or process that needs immediate correction, as it can lead to chronic excess inventory or constant stockouts.
- The Tracking Signal monitors bias over time. It calculates the cumulative error and signals when the forecast is consistently deviating in one direction beyond an acceptable threshold. A triggered tracking signal is a clear alert that the forecasting model may no longer be valid and requires re-evaluation. A low-bias forecast is often more valuable than a slightly more accurate but highly biased one because it is more reliable.
Inventory Performance Metrics
These KPIs connect your demand plan directly to the financial health and efficiency of your inventory management.
- Inventory Turnover measures how many times your company sells and replaces its inventory over a specific period. A higher turnover rate is generally better, indicating efficient sales and avoidance of overstocking.
- Days of Supply (DOS) shows how many days your current inventory will last based on the forecasted demand. This helps in managing cash flow and warehouse capacity, ensuring you have enough stock but not too much.
- Safety Stock Levels are a direct output of demand variability. Measuring the amount of safety stock you hold ensures your buffer against uncertainty is appropriate and not excessively tying up capital.
- Stockout Rate calculates the percentage of items that are out of stock when a customer places an order. This is a direct measure of lost sales opportunities and potential customer dissatisfaction.
- Obsolete Inventory Percentage tracks the portion of your inventory that is no longer sellable. This KPI highlights waste and is a critical input for improving product lifecycle management.
Customer Service and Fulfillment Metrics
These are the ultimate customer-facing KPIs, measuring how well the demand and supply plan meets customer expectations.
- Order Fill Rate measures the percentage of a customer’s order that is successfully fulfilled from stock on the first shipment. It’s a key indicator of your immediate ability to serve demand.
- On-Time In-Full (OTIF) is a stricter and more holistic metric. It measures the percentage of orders that are delivered with the correct quantity of every item on the date the customer requested. It is considered a gold standard for supply chain performance.
- Perfect Order Rate takes OTIF a step further by including factors like damage-free transit and correct invoicing. It measures the percentage of orders that are flawlessly executed from start to finish.
- Backorder Rate tracks the percentage of orders that cannot be fulfilled at the time of purchase and must be shipped later. High backorder rates are a strong signal of forecasting issues and potential customer churn.
Process and Operational Efficiency Metrics
These advanced KPIs evaluate the demand planning process itself, helping you refine how your team works.
- Forecast Value Added (FVA) is a powerful diagnostic tool. It measures whether each step in your forecasting process (like manual overrides from the sales team) actually makes the forecast better or worse compared to a simple statistical baseline. It helps eliminate low-value activities and focus effort where it counts.
- Planning Cycle Time measures the total time it takes to complete one full demand planning cycle, from data gathering to publishing the final plan. A shorter cycle time indicates a more agile and responsive organization, capable of adapting quickly to market changes.
Advanced KPIs in Demand Planning
Beyond essential KPIs, there are also some advanced KPIs that a business can use to further enhance its demand planning process. These are generally more complex and sophisticated, often providing more insights and value. Let us delve into these KPIs and what makes them more advanced.
Long-Term Capacity Requirement Forecasting Accuracy
Long-term capacity requirement forecasting accuracy is an advanced KPI in demand planning. It measures how well the demand forecasts match the long-term capacity requirements of the business. It can be calculated as the ratio of the long-term capacity requirement forecast error to the long-term capacity requirement, expressed as a percentage. Long-term capacity requirement forecast error is the difference between the long-term capacity requirement forecast and the long-term capacity requirement, either in absolute or relative terms. A lower long-term capacity requirement forecast error indicates a higher long-term capacity requirement forecasting accuracy, and vice versa.
Long-term capacity requirement forecasting accuracy is important for the demand planning process, as it can help a business plan and optimize its long-term capacity investments. These might include building new facilities, acquiring new equipment, or hiring new staff. It is therefore of utmost importance that it remains accurate. Here are a few examples of improvements that can be made to long-term capacity requirement forecasting accuracy:
- Use a suitable forecasting method and technique, based on the type and pattern of the long-term demand data.
- Update and revise the long-term demand forecasts regularly, based on the latest information and feedback.
- Incorporate external factors and events that may affect the long-term demand, such as macroeconomic trends, technological innovations, and environmental regulations.
- Compare the long-term capacity requirement forecasting accuracy across different products, regions, and time periods, and identify the areas of improvement.
Intelligent Demand Planning KPIs
Intelligent demand planning KPIs use artificial intelligence (AI) and machine learning (ML) to enhance the demand planning process. Intelligent demand planning KPIs can leverage the power of AI and ML to:
- Analyze large and complex data sets, and extract meaningful insights and patterns therefrom.
- Generate more accurate and reliable demand forecasts, and adjust them dynamically based on the changing conditions and scenarios.
- Optimize the inventory, production, and distribution levels, and balance them with the demand and supply.
- Detect and prevent anomalies and outliers in the demand data, and handle them appropriately.
- Provide recommendations and suggestions for improving the demand planning process, and support the decision-making.
Below is a list of some examples of intelligent demand planning KPIs:
- Demand Sensing: Sense and respond to real-time changes in demand, such as customer behavior, preferences, and feedback.
- Demand Shaping: Influence and modify the demand, such as through pricing, promotion, and product design.
- Demand Segmentation: Group and classify the demand, based on the characteristics and attributes of the products and customers.
- Demand Simulation: Create and test different scenarios and assumptions, and evaluate their outcomes and impacts on the demand.
Should your company want to implement intelligent demand planning KPIs, here are a few recommendations to take into consideration:
- Use a suitable AI and ML platform and tool, based on the type and complexity of the demand data and problem.
- Train and validate the AI and ML models, and ensure that they are accurate and robust.
- Integrate the AI and ML models with the existing demand planning system and process, and ensure that they are compatible and consistent.
- Monitor and evaluate the performance and results of the AI and ML models, and update and improve them accordingly.
Read our case study on how one US-based company improved and streamlined its S&OP process with Intuendi-AI
How to Select the Right KPIs for Your Organization
There is no universal list of perfect KPIs. The right set of metrics for your company is deeply tied to your unique business context and strategic objectives. That is why the first step is to align KPIs with specific business goals. For example, a company competing on cost leadership will likely prioritize metrics like inventory turnover and obsolete inventory percentage. In contrast, a business focused on providing a premium service will place a much heavier emphasis on OTIF and the perfect order rate. Your strategy dictates what you should measure.
It is also crucial to consider your industry and product lifecycle stage. The KPIs for a fast-moving consumer goods company are vastly different from those for a manufacturer of heavy industrial equipment. Similarly, the metrics you use to manage a new product launch (where adoption rate is key) should differ from those used for a mature, stable product (where efficiency is paramount).
You should also aim for a balanced scorecard that provides a comprehensive view without overwhelming your team. It’s better to track a handful of truly meaningful KPIs well than to drown in a sea of data. Choose metrics from each of the core categories to ensure you are not optimizing one area of the business at the expense of another. Keep it simple, focused, and actionable.
Implementing and Tracking Your Demand Planning KPIs
Putting a KPI framework into practice is a journey that requires the right foundation, tools, and culture.
Establishing a Data Foundation and Tools
Accurate KPIs are impossible without accurate data. The first and most critical prerequisite is establishing strong data hygiene. This means ensuring your source data from sales, inventory, and operations is clean, consistent, and reliable. Without a trustworthy foundation, any KPI you calculate will be flawed. Once your data is in order, you can select the right tools for the job. For smaller organizations, well-structured spreadsheets may suffice. However, larger enterprises will benefit immensely from dedicated demand planning software and business intelligence (BI) platforms that can automate data collection, calculation, and visualization, freeing up your team to focus on analysis and action.
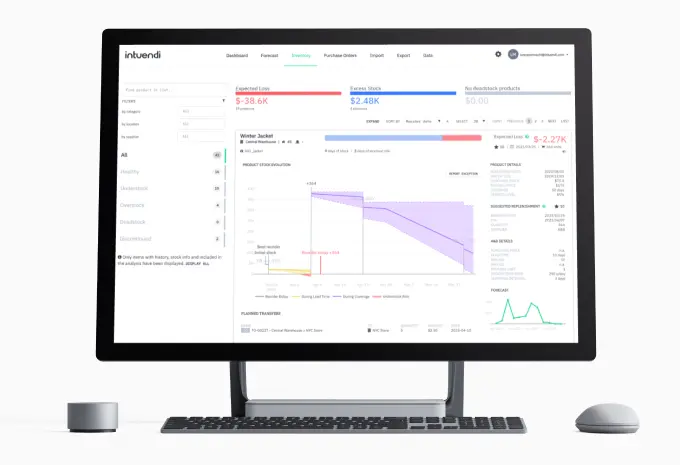
Creating an Effective KPI Dashboard
Data becomes powerful when it is visualized effectively. A well-designed KPI dashboard transforms raw numbers into actionable insights. The key is to make it visual, intuitive, and focused on highlighting exceptions and trends. Instead of presenting a wall of numbers, a good dashboard uses charts and color-coding to immediately draw attention to areas that are off-track. It should also allow users to drill down for root cause analysis, moving from a high-level view of a problem (like a low fill rate) to the specific products or regions causing it. The best dashboards are tailored to their audience, offering a strategic overview for executives and more granular, detailed views for planners.
Building a Culture of Continuous Improvement
Tools and dashboards are only as effective as the culture that surrounds them. To truly drive change, you must establish a regular rhythm for reviewing KPIs, typically within your monthly S meetings. This creates accountability and ensures that insights are translated into action. Start by setting a baseline for your current performance, then work collaboratively with stakeholders to set realistic, incremental improvement targets. Most importantly, frame KPIs as tools for process improvement, not personal blame. When teams see KPIs as a way to identify and solve problems together, they become the engine of a culture that constantly learns, adapts, and improves.
Common Pitfalls to Avoid with Demand Planning KPIs
Implementing a KPI framework can be transformative, but several common mistakes can derail your efforts. Being aware of these pitfalls is the first step toward avoiding them.
One of the most frequent errors is “KPI Overload.” In an attempt to be thorough, teams start tracking dozens of metrics, which dilutes focus and creates more noise than signal. Another is the “Accuracy-Only Trap,” where the entire team becomes obsessed with forecast accuracy while ignoring inventory levels, bias, or customer service. This narrow focus often leads to poor overall business outcomes.
Even with the right metrics, many organizations fall into the trap of “KPIs without Action.” They measure and report for the sake of it, but there is no clear process for using the insights to drive decisions and make changes. This is closely related to “Ignoring the Narrative,” which is the failure to look beyond the numbers. A KPI tells you what happened, but you must investigate the qualitative context to understand why it happened.
Finally, a common failure is not adapting your KPIs as your business strategy or market conditions change. A KPI framework is not a one-time project; it is a living system that must evolve with your organization. By sidestepping these common errors, you can ensure your KPIs remain relevant, actionable, and a powerful catalyst for driving supply chain excellence.
Read our free eBook on short-term replenishment and mid to long-term planning