

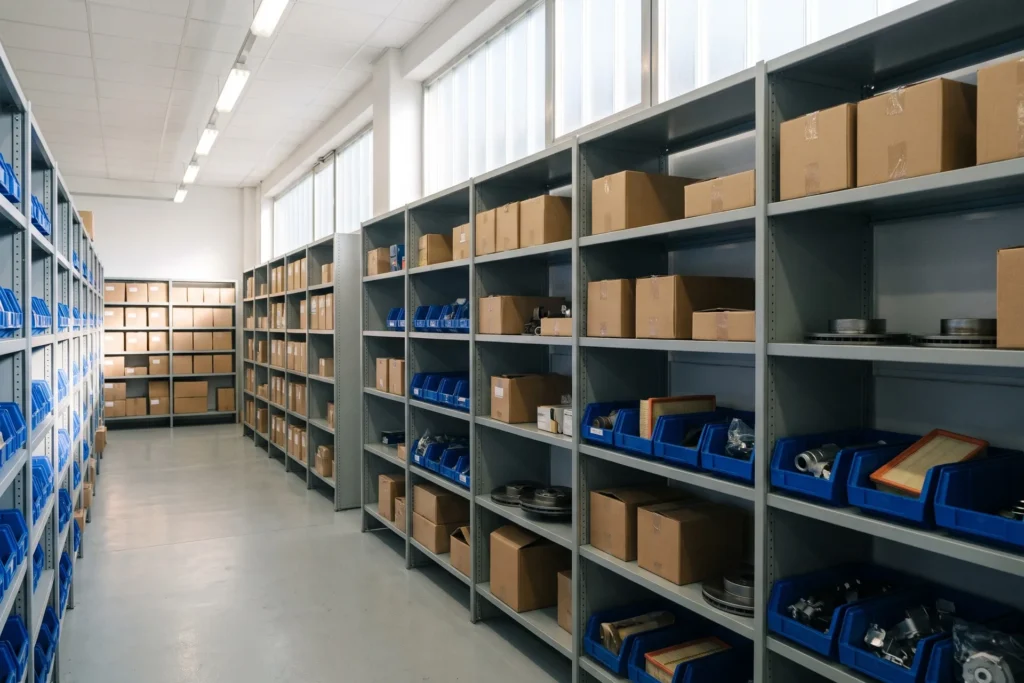

Inventory optimization means holding the right amount of stock, in the right place, at the lowest cost that still delivers the service level the business has chosen. It is not the same as cutting inventory: a company can have too much stock of some products and too little of others at the same time. This guide explains what inventory optimisation is, the trade-off at its core, the main techniques, how to optimize inventory step by step with a worked example, and the KPIs to track.
What Is Inventory Optimization?
Every product in stock answers two questions: how much to keep, and when to reorder. Inventory optimization is the practice of answering them with data for every product and location, so that stock follows expected demand, supplier lead times and the importance of each product, rather than habit or rules of thumb.
An optimized inventory is one where the money tied up in stock earns its keep. Fast sellers and key products are available when customers want them; slow movers do not fill the warehouse; and the business knows how much stock it needs to reach its service targets.
The Core Trade-off: Service Level vs Inventory
More stock means fewer stockouts, but each extra point of availability costs more than the one before. Going from 90% to 95% service level needs some extra safety stock; going from 95% to 99% needs a lot more. Inventory optimization is about choosing where on that curve each product should sit.
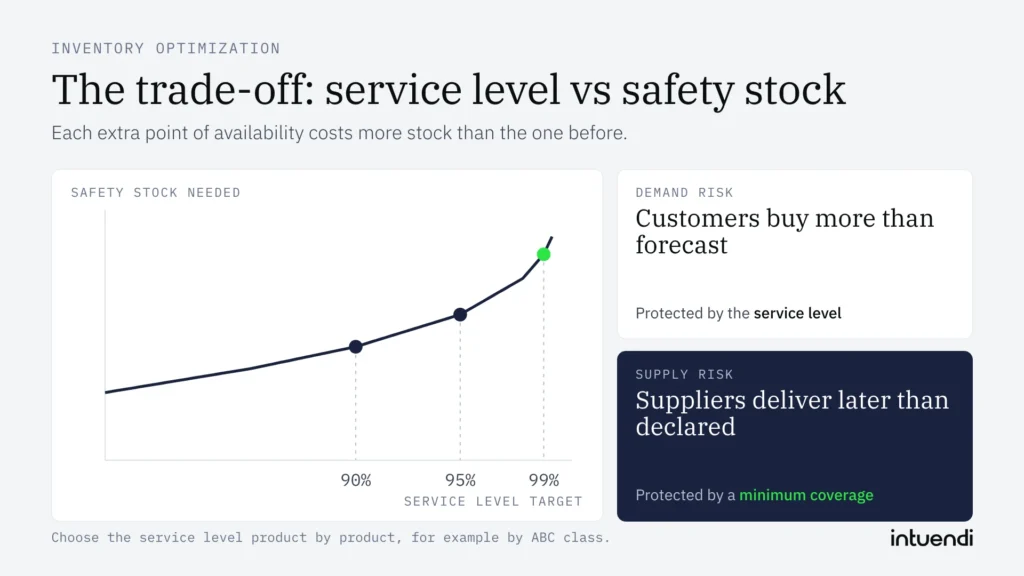
Stock protects against two different risks. Demand risk, customers buying more than forecast, is handled with the service level. Supply risk, suppliers delivering later than declared, is handled with a minimum coverage. Mixing the two leads to buffers that are too large in some places and too small in others.
Inventory Optimization Techniques
- ABC segmentation. Classify products by revenue, margin or volume, and give each class its own service level. A-class products get the highest protection; C-class products can accept more risk. See ABC analysis.
- Safety stock. The buffer that covers demand above the forecast during the lead time, sized on the service level and on how much demand varies. See safety stock.
- Reorder point. The stock level that triggers a new order, so that it arrives before the shelf is empty. See reorder point.
- Order quantity and coverage. How much to order each time, balancing ordering costs and holding costs (the economic order quantity) or, more simply, how many days of demand each order should cover.
- Rebalancing between locations. Moving stock from a location with excess to one with a shortage before buying more. See inventory balancing.
- Clearing excess and slow movers. Finding products that will not sell before the end of their life and acting early. See slow-moving inventory.
How to Optimize Inventory in 5 Steps
- Clean the data. Sales history at product and location level, current stock, open orders, and the actual lead times of each supplier. Remove the effect of past stockouts and one-off promotions from the history.
- Forecast demand with its uncertainty. A single number is not enough: the safety stock depends on how far demand can move from the forecast. See demand forecasting.
- Set targets by class. Choose the service level for each ABC class, and a minimum coverage for suppliers whose lead times are unreliable.
- Calculate the parameters. Safety stock, reorder point and order coverage for every product and location, recalculated as demand and lead times change.
- Review orders and results. Check suggested orders before they go out, then track service level, turnover and excess stock to see whether the targets are right.
Inventory Optimization Example
Take a rain jacket reordered so that each order covers 60 days of demand. Ordering more often, with each order covering 30 days, means smaller orders: the stock that arrives with each order is lower, and so is the average stock. The service level, which sizes the safety stock, does not change. The figures below are an example from a demo account.
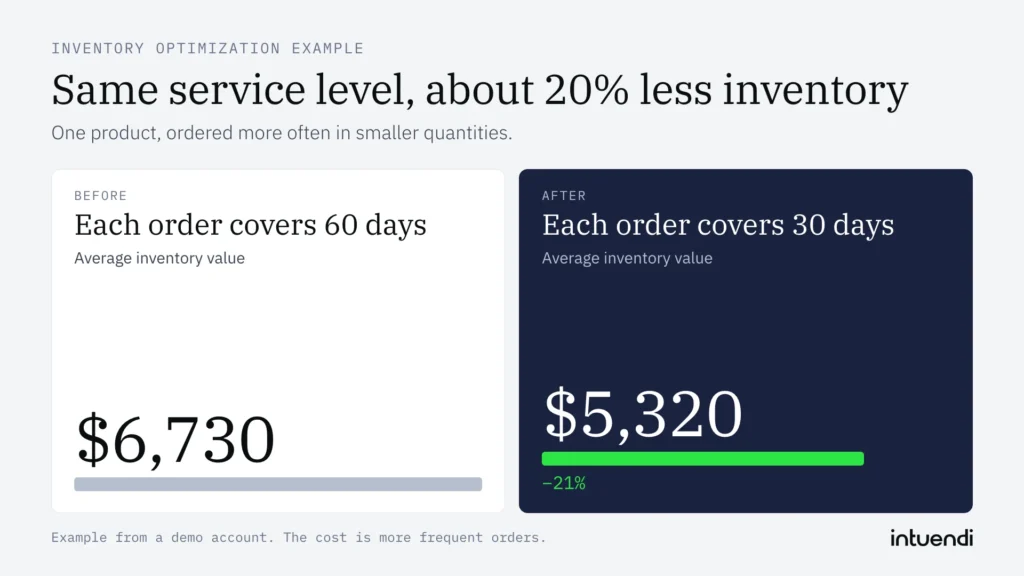
In this example the average inventory value goes from $6,730 to $5,320, about 20% less, without changing the service level. The cost is more frequent orders, and more moments in which a late delivery can matter, which is worth checking against supplier minimums and transport costs.
Order coverage is one lever; holding the right stock in each ABC class is another. In the example below, a planner asks Symphonie, the AI assistant inside Intuendi, where inventory is out of balance on a demo account: the answer compares the days of stock of each class with its coverage target.
Inventory Optimization KPIs
- Service level or fill rate: the share of demand served from stock.
- Inventory turnover: how many times stock is sold and replaced in a year.
- Days of stock against the coverage target, for each product and class.
- Excess stock and deadstock value: capital tied up in products that will not sell in time.
- Sales at risk: the value of demand that current stock and incoming orders will not cover.
Multi-echelon Inventory Optimization
When stock sits at several levels, such as a central warehouse feeding regional warehouses or stores, each level affects the others. Holding more stock centrally can reduce what each store needs, and the other way round. Multi-echelon inventory optimization sets the targets for the whole network instead of one location at a time.
Inventory Optimization Software
Optimizing a handful of products in a spreadsheet is possible. Doing it for thousands of products and locations, every week, is not. An inventory optimization software like Intuendi forecasts demand with its uncertainty, applies service levels by class and coverage targets, tracks real supplier lead times and suggests purchase and transfer orders that a planner can approve or change. It also shows, product by product, where stock is short and where it is in excess, so the team knows where to act first.
Better Inventory, Not Just Less
Inventory optimization is a balance, not a cut. The companies that do it well decide which products deserve the most protection, size buffers on the risks they really face, and review the results every month. The outcome is usually less stock overall and fewer stockouts on the products that matter.
